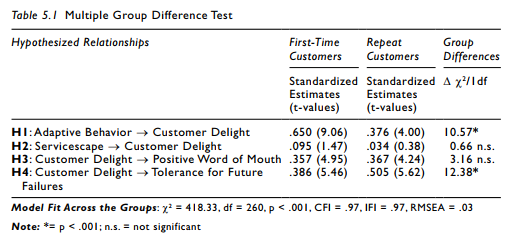
Here is a way you can present your results in a table format that will be easy for the reader to understand. In a two group analysis, you need to present the relationship strength (standard- ized coefficient) and t-values for each relationship.You also need to show the significance of the comparison across groups.This can be done by presenting the chi-square differences across both groups when that specific relationship is constrained.
Example 5.2:
Source: Thakkar, J.J. (2020). “Procedural Steps in Structural Equation Modelling”. In: Structural Equation Modelling. Studies in Systems, Decision and Control, vol 285. Springer, Singapore.
31 Mar 2023
28 Mar 2023
28 Mar 2023
27 Mar 2023
31 Mar 2023
29 Mar 2023